top of page

BRYAN MURRAY
DESIGNER | PHOTGRAPHER | VIDEOGRAPHER




INFOGRAPHICS
FEMA/DHS
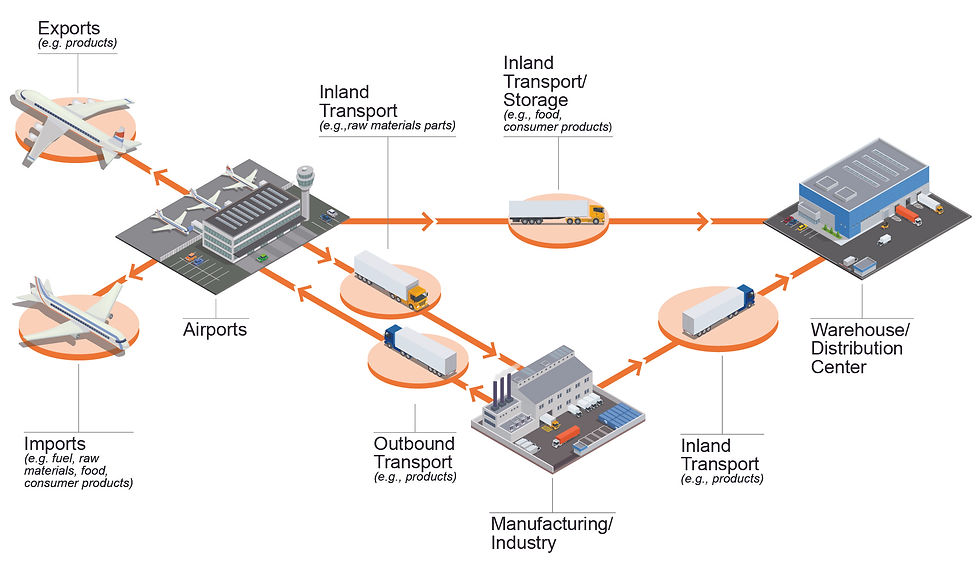
These infographics were designed to be used in a report the FEMA was putting together. This report explained the destruction of the island of Puerto Rico after Hurricane Maria, and laid out plans for the rebuilding of the islands infrastructure. This report showed how interdependent each of the utilities are to one another.
These graphics were used to illustrate these interdependencies, as well as how each of the utilities worked. A system using iconography and color was developed to distinguish the different sections of the report and which part of the infrastructure it was speaking to.
This report was shared with members of congress and may other higher level agents in the government.
bottom of page